Well, this post is not to praise Web Developer, but rather about what I saw just yesterday. By default, the extension installs with icons and text, (i.e.) it looks like this.
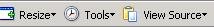 The 'View Source' you see is the last menu option in the toolbar. However, menu options do exist even after View Source. To view those, use any of the following two ways:
- Click Tools(on your browser) -> Extensions -> Web Developer -> Options. Select General in the left list, and select 'Text' in the 'Display Toolbar With' combo.
- Slam the mouse pointer to the end of the toolbar and click. You should get a menu with the options: Persist Styles, Reset Page, Options..., Help..., and About.... Select Options. Select General in the left list, and select 'Text' in the 'Display Toolbar With' combo.
 The 'Q' specifies which rendering mode the current page uses. Q is for Quirks, while S is for Standards.
The 'N' specifies whether JS errors have occurred on the page. If yes, 'N' changes to 'E'. However, I had a page where there were errors on page load, but the extension showed 'N'.
Now, why did I not come across this information on any other page?
Update: Could this be a resolution problem? The computer in which I got this problem had a maximum resolution of 800 * 600. Now on my new computer with a resolution set to * 768, I don't face this issue.

1 comment:
You have something for IE too. It is called 'Internet Explorer Developer Toolbar'. Grab it here:
http://www.microsoft.com/downloads/details.aspx?FamilyId=E59C3964-672D-4511-BB3E-2D5E1DB91038
Post a Comment